The next 24 hours stay tuned because we will be banging out some doozies. Let’s start with an email we received from a local Hindu neighbor asking if there was any truth to the attached graphic being sent around WhatUp App Indian chats.
After in-depth review this is what Frisco Chronicles can say: Looking strictly at the graphic itself, there are several issues that would raise questions regardless of which candidate someone supports.
1. It appear to be speculative numbers presented with a high degree of certainty
The graphic gives:
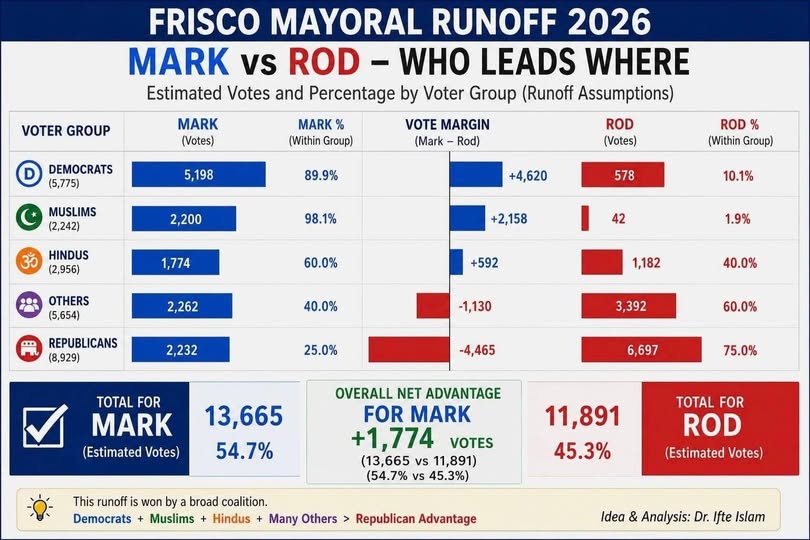
* Exact vote totals
* Exact percentages
* Exact voter-group turnout assumptions
* An exact final margin of 1,774 votes
Yet the graphic is labeled as “Estimated Votes and Percentage by Voter Group (Runoff Assumptions).”
This graphic does not contain actual published runoff data, polling data, or any legit disclosed methodology. The goal appears to be for this inaccurate misleading graphic to influence voters that the election is already won when it is not even close. Readers should be asking what is the source for the estimated turnout and vote-share percentages for each group?
The graphic does not explain:
* How the author determined there are exactly 2,242 Muslim voters participating.
* How they estimated 98.1% support from Muslims.
* How they estimated 89.9% support from Democrats.
* How they estimated 60% support from Hindus.
* How they estimated turnout levels for each category.
Without methodology, readers cannot consider these to be independently verified numbers.
2. PROBLEMATIC VOTER GROUPS
The chart mixes: Political affiliation (Democrats, Republicans), Religion (Muslims, Hindus), and a catch-all category (“Others”)
That creates an overlap problem.
For example:
* A Muslim voter can also be a Democrat.
* A Hindu voter can also be a Republican.
* A Hindu voter can also be an Independent.
The categories are not mutually exclusive. It is very possible that data was countrd twice in this graphic making it false, and accurate and misleading. A reader has no way to determine whether the author accounted for this.
3. CREATING A “BANDWAGON EFFECT”
Political science has long discussed a phenomenon where some voters are influenced by perceptions of momentum. If voters see: MARK projected to win 54.7% to 45.3% then some people may conclude:
* “The race is already decided.”
* “My vote doesn’t matter.”
* “Everyone else is voting that way.”
That can affect behavior even if the numbers are speculative. Frisco Chronicles would speculate this graphic was created in order to encourage Muslim, Hindu, or Swing / Democratic voters not to go out and vote for Mark’s counterpart because the race is already won!
4. CREATES VOTER DISCOURAGEMENT
The opposite effect can occur. A Rod supporter might see: Mark already leads by 1,774 votes and think “There’s no point voting.” Likewise, a Mark supporter could think “Looks like we’ve got this wrapped up.”
Both reactions can reduce turnout. When projections are unsupported or presented without methodology, they can distort perceptions of the competitiveness of a race.
5. REINFORCES IDENTITY-BASED VOTING NARRATIVES
The graphic’s central argument appears to be Democrats + Muslims + Hindus + Others > Republican Advantage
That message encourages readers to think about the election primarily through religious and demographic blocs rather than individual issues or candidate qualifications.
Some voters may view that as divisive because it frames electoral success around demographic coalitions instead of policy positions.
IN SUMMARY
This presentation is designed to look authoritative with underlying evidence supporting it which is simply not true. None of his data has been released yet yet by Collin County or Denton County Elections. That means there is no data currently to accurately predict who could win this election. It is what researchers call the “illusion of precision”. It is often used in certain cultures and religions to try and call in the vote.
The key issue is transparency. The fact that it’s only circulating in WhatsApp app Indian groups tells me it’s designed to influence the Indian vote. What are Indian community needs to understand is you need to vote on the issues that affect your family. Don’t vote how you are told, don’t vote out of fear, vote for the best candidate who’s gonna do right for you.
If I had to guess the name at the bottom of the document is Dr Ifte Islam. Maybe it’s being put out by the Muslim community to influence the Hindu Desis / South Asian voters.
Some clues that could suggest AI assistance very clean infographic layout, consistent typography, formulaic political-analysis structure and the generic stock-style iconography.
What stands out more than AI involvement is the absence of methodology. “What data source supports these exact vote totals and percentages, and can that methodology be independently verified?”
0 Comments